We have all been there – whether it was for a thesis, paper, or report, the time for analyzing data eventually arrives. Statistical analysis plays a pivotal role in social sciences, providing a structured approach to unravel complex data. More often than not, however, the available data is not catered in a way tailored to the preplanned research design. In such cases, you are left with no choice but to resort to an extensive search for suitable variables to operationalize your model, scouring multiple sources both far and wide. When you finally find what you are looking for, you are hit by the realization that the data you need are from different sources, were collected across different units of analysis, need to be aggregated for your purpose, and in any case, require to be merged in order to be analyzed with any common statistical program.
Those with experience in merging data can attest that it is an exceedingly demanding task, and if you are unlucky, it can consume a significant portion of your time devoted to a project. At least that used to be the case before the launch of Demscore, a research e-infrastructure that streamlines data merging and harmonization.
Demscore aims to build a world-leading hub for contextual data with user-friendly access to documentation, and online visualization tools, that are open access and free to use worldwide. The infrastructure is a collaboration between esteemed research institutes across Sweden, including the Varieties of Democracy (V-Dem) and Quality of Government (QoG) institutes at University of Gothenburg, Comparative Policy Laboratory (COMPLAB) and the Historical Data Archive (H-DATA) at Stockholm University, Uppsala Conflict Data Program (UCDP) and The Violence Early Warning System (VIEWS) located at Uppsala University, and the Representative Democracy Data Archive (REPDEM) hosted by Umeå University.
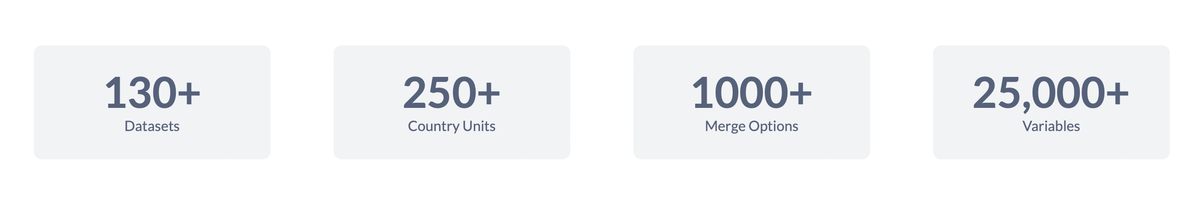
Demscore not only incorporates and presents 134 datasets in a user-friendly way, saving time on navigating the available data but also manages to efficiently merge the data from these research institutes in a plethora of different combinations, enabling customized datasets, ready for analysis in a matter of seconds. As of today, there are over 1000 merge options for over 25.000 variables available on the platform, waiting to be explored and combined into customized datasets.
Now, this may seem overwhelming at first. Hence, we want to introduce a simple example of how data can be combined and retrieved through the platform. Imagine we want to explore the relationship between corruption perception indicators in the Quality of Government (QoG) Standard Time Series dataset, and various child benefit indicators in the Comparative Policy Laboratory (COMPLAB) Child Benefits Dataset. Once we have read up on the available data sources for those topics on the partner pages, we can start creating our customized dataset.
We access the download interface on the Demscore website, where we are presented with four options on how to select and download data.
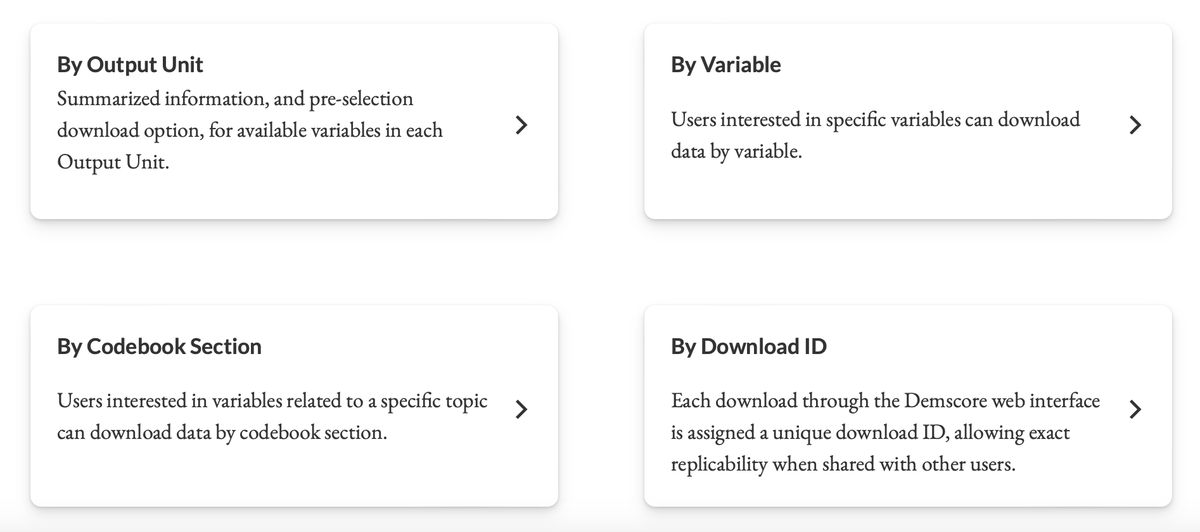
No matter which option we select, there are three common requirements: Output Unit, file format, and the variables of interest. Due to the slight differences in country coding systems between these datasets, merging and ensuring data quality would previously have required manual identification and adjustments to identifier (or identification) variables. With Demscore, this tedious process is streamlined into a few simple steps.
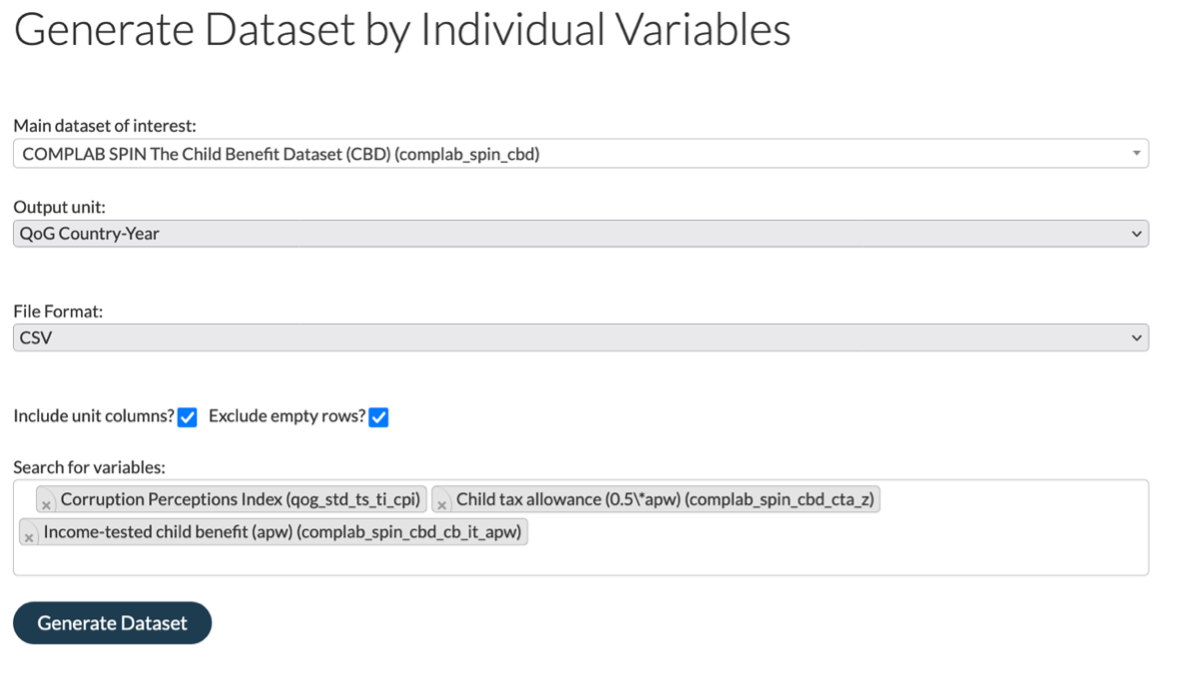
All datasets in Demscore use different identifiers, such as country and year, to organize the data. Depending on our data preference, we can choose different Output Units (i.e. formats). In this example, we are selecting QoG Country-Year, which will serve as the format that our selected variables will be matched or “translated” to and finally retrieved in. Since we are primarily interested in a QoG dataset that has the QoG Country-Year Output Unit as the unit of analysis, this is a suitable choice.
Next up we must select the file format for the download, which is available as a .rds file, compatible with R, a .dta file, compatible with Stata, and as a .CSV file. Finally, we select the variables we want to be merged into our customized dataset.
If you need inspiration for your variable selection, you can either browse the partnering projects’ codebooks containing all their variables or our thematic datasets that group variables across all sources into topics.
For this example, we have selected the Corruption Perception Index from the Quality of Government Dataset, and the Child tax allowance and Income-tested child benefit from the COMPLAB dataset. Now we can go ahead and press "Generate Dataset."
After generating the dataset, we will receive a unique download ID for future reproducibility of our study. This download ID can be shared with supervisors, co-authors, or anyone interested. They will be able to retrieve the same data without needing to replicate any code. And, just in case you haven't realized its significance yet – you will never again have to submit any data-cleaning script or do-file along with your project. All that is required for replication is the download ID, which works seamlessly across all versions.
We then click 'Download' to receive a .zip folder with our customized dataset, a tailored codebook with information about our selected variables, and the Demscore Methodology containing an in-depth explanation of how the merging process works. Voilà! You can now start your analysis without further ado.
In the realm of data analysis, we have all encountered the challenges of searching for suitable variables, merging datasets, and navigating the potential pitfalls inherent in these processes. Not only is it a tiring process, but it runs the risk of altering the original research design and impacting the validity of the study. We hope that the presented example, albeit simple, highlights one of the contributions of Demscore so that for future projects you might use the features provided here, allowing you to focus more time on your analyses and less on the intricacies of finding and merging datasets.