Demscore Methodology
Demscore provides free access to harmonized data on Democracy, Environment, Migration, Social Policy, Conflict and Representation from several of the world’s most prominent social science research institutes.
On this page, users can find a short summary of the Demscore Methodology, including a description of the general approach, and dataset- and Output Unit combinations.
To read and download the full version of the Demscore Methodology, click the button below.
The potential that lies in the interdisciplinarity of Demscore data is accompanied by the challenge of its diversity. On this page, we outline a summary of the methodological considerations, choices, and procedures guiding the development of the Demscore project, stretching across the construction of a common e-infrastructure to fully harmonized data from all sources.
We continually review our methodology—and occasionally adjust it—with the goal of improving the quality of Demscore indicators and indices. We report the challenges of the harmonization process and present the solutions provided by the Demscore Team and its member projects.
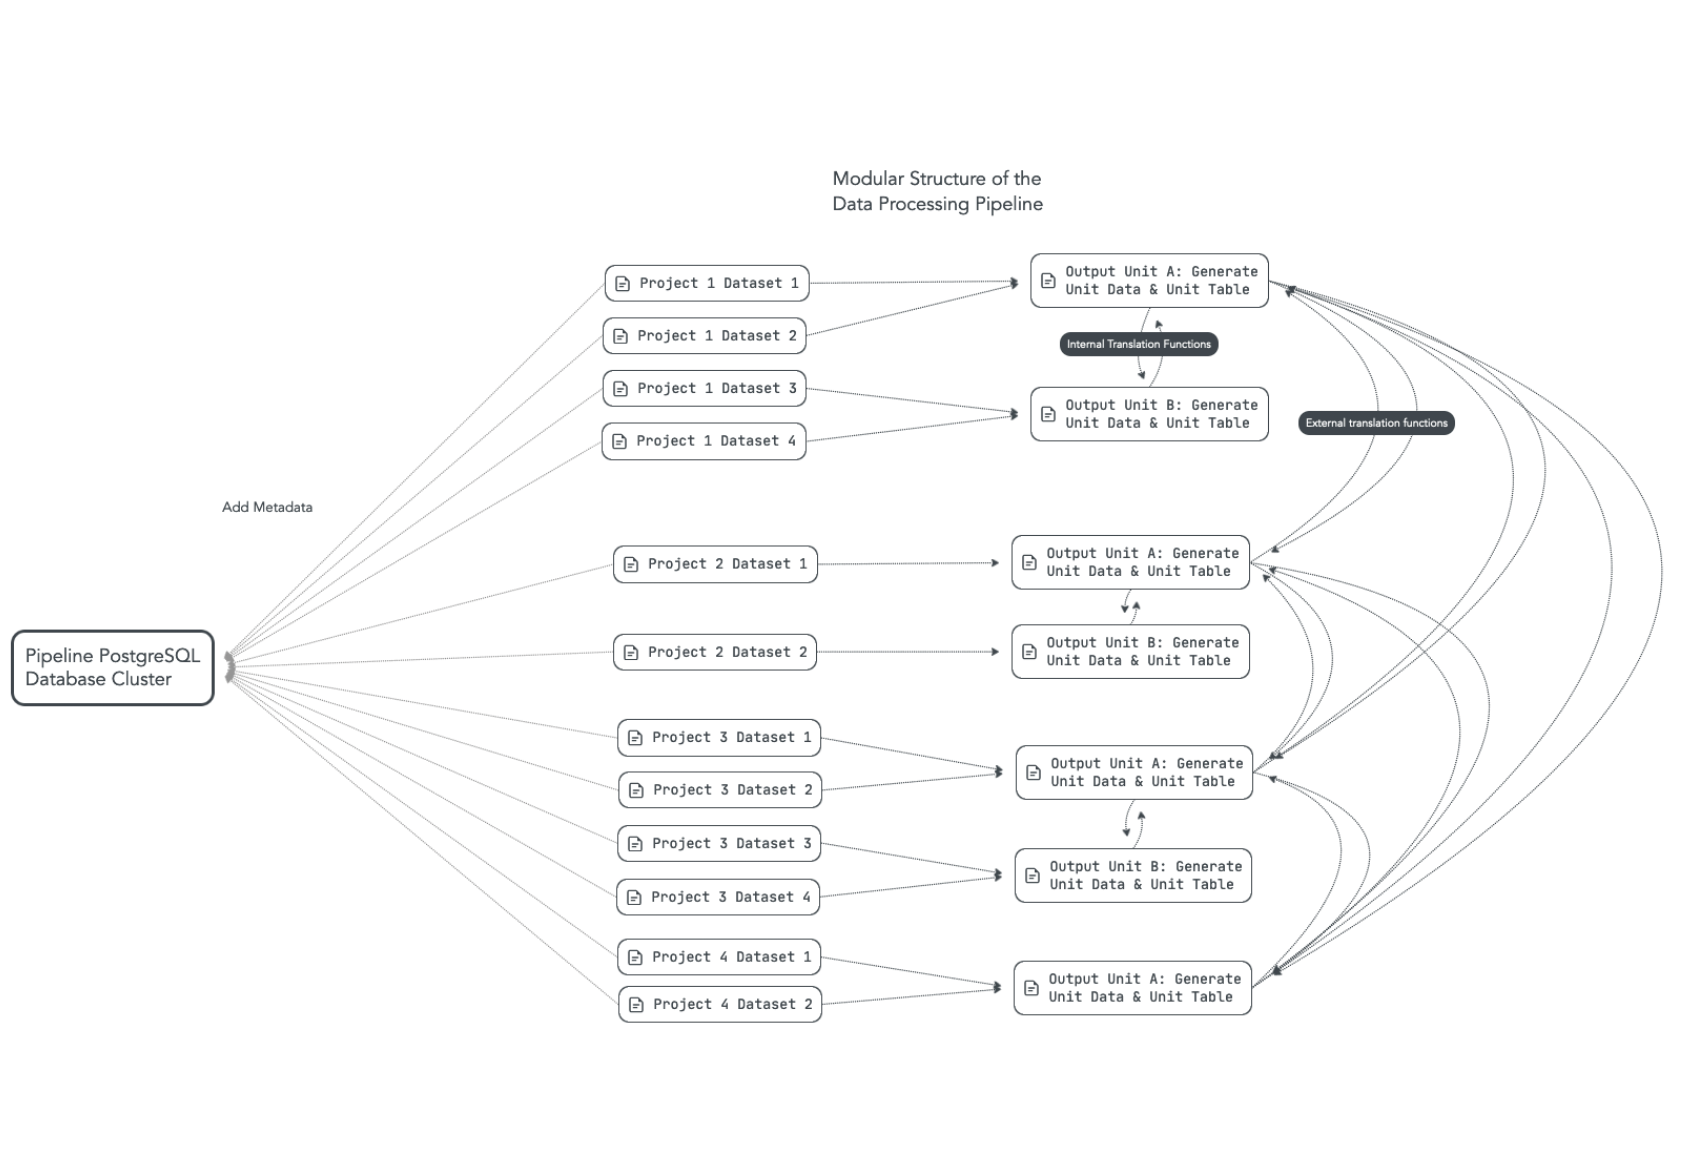
In order to present data merged from different sources in a consistent way, we have developed an innovative and systematic data harmonization process. Each dataset in Demscore has its own dataset unit, i.e., unit of analysis. Based on their units of analysis, datasets are grouped into Output Units and finally merged and translated through these Output Units.
Several datasets within the same module have very similar units. That is, if more than one dataset within a module has the combination of columns containing e.g., the country and year as their identifying unit, we take the union of the country-year combinations from each dataset with similar units and define the result as an Output Unit. This is illustrated in the figure below, which also demonstrates that we use these Output Units to translate and merge data from different units and modules together, i.e., we translate between Output Units both within and across projects. We refer to translations between Output Units from the same Module as “internal translations”, while across-Module translations are called “external translations”. In addition, we store all meta data for datasets and information about translations in a harmonized PostgreSQL Database cluster.
Dataset Unit: A Dataset Unit, e.g., Country-Year, describes the level at which observations for a dataset are collected. Observations are stored as rows in a table. In order to find a specific observation, e.g., information on a specific country for a given year, special table columns are needed as identifiers. Comparable to page numbers in a book, these columns help us find the location of the table row that contains the values for each variable of interest for a given observation i.e., a given country and year. The information necessary to identify these rows may be stored in a single or in a combination of several identifier columns. In the most common example for datasets that have the Country-Year Dataset Unit, the country and year information is each stored in a separate column.
Output Unit: An Output Unit, e.g., QoG Country-Year, is defined as an output format in which variables can be retrieved from one or more datasets through a strictly defined output grid. A unit table defining this output grid contains unit identifier columns with u_ prefixes and the table is sorted based on these unit identifier columns and has a fixed number of rows. An Output Unit has specific definitions for the level at which observations are presented, e.g., country definitions. For example, variables from a QoG dataset may have been collected under QoG country definitions, but in Demscore can also be retrieved through a V-Dem Output Unit which follows V-Dem country definitions.
Unit Columns: Unit columns are based on the columns that constitute a Dataset Unit. They are added to the original dataset and marked by a unit prefix (consisting of a u_ and the dataset unit name) before the original variable name. Unit columns can contain slightly modified data, e.g., NAs are replaced by a default value. Sometimes we add additional columns to the unit table, for instance if a dataset includes both a country_id column with a numeric country code, we add the variable storing the full country name to the unit table as well for better readability.
While Dataset A of Project X for example has observations for European countries from 1944 to 2015, Dataset B for Project X has observations for all countries from 1990 to 2021. The Country-Year unit table for Project X will have rows for European countries from 1944 to 1989 as well as rows for all countries from 1990 to 2021. In other words, a unit table always covers all possible combinations of unit values in the identifier columns of datasets with the same dataset unit.
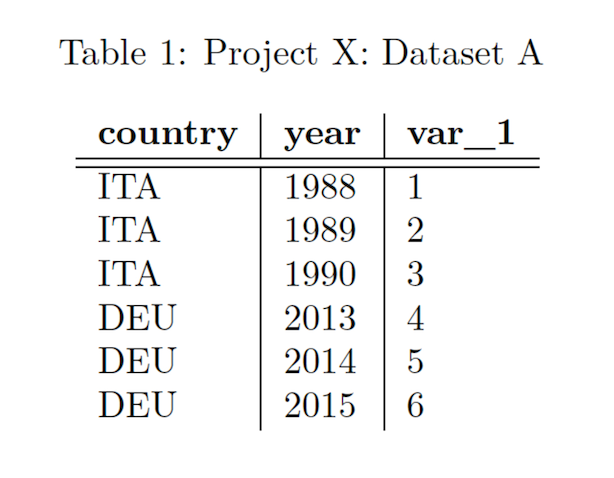
This is illustrated using the following example based on a subset of the data above: Member Project X has two datasets available; Dataset A and Dataset B. Dataset A is a table with three columns, called country, year and var_1 with corresponding values in five rows.
Dataset A is a table with three columns, called country, year and var_1 with corresponding values in five rows. Dataset A has the Unit Country-Year, meaning each row in the dataset is identified by a unique combination of countries and years.
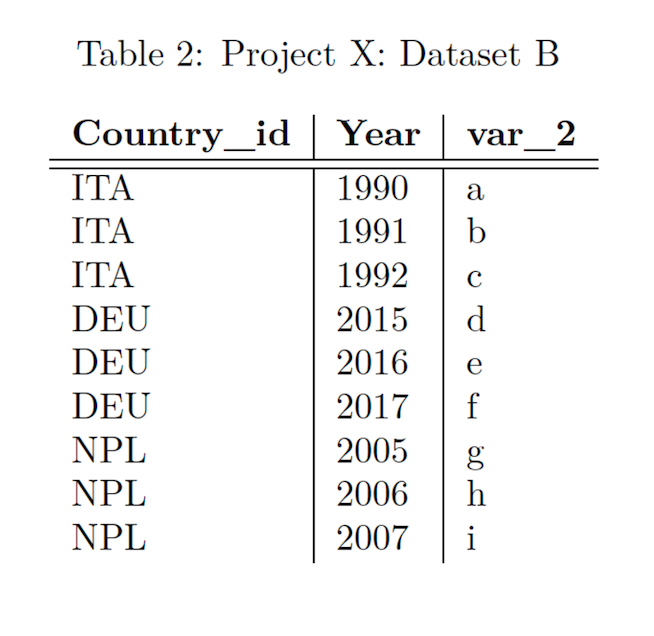
Dataset B is a table with three columns, country_id, year and var_2, with corresponding values in eight rows. It also has Country-Year as its unit, meaning each row in the dataset is identified by a unique combination of countries and years. Please note that Dataset B contains some country and year combinations that can be found in Dataset A as well, but also country and year combinations that are not included in Dataset A.
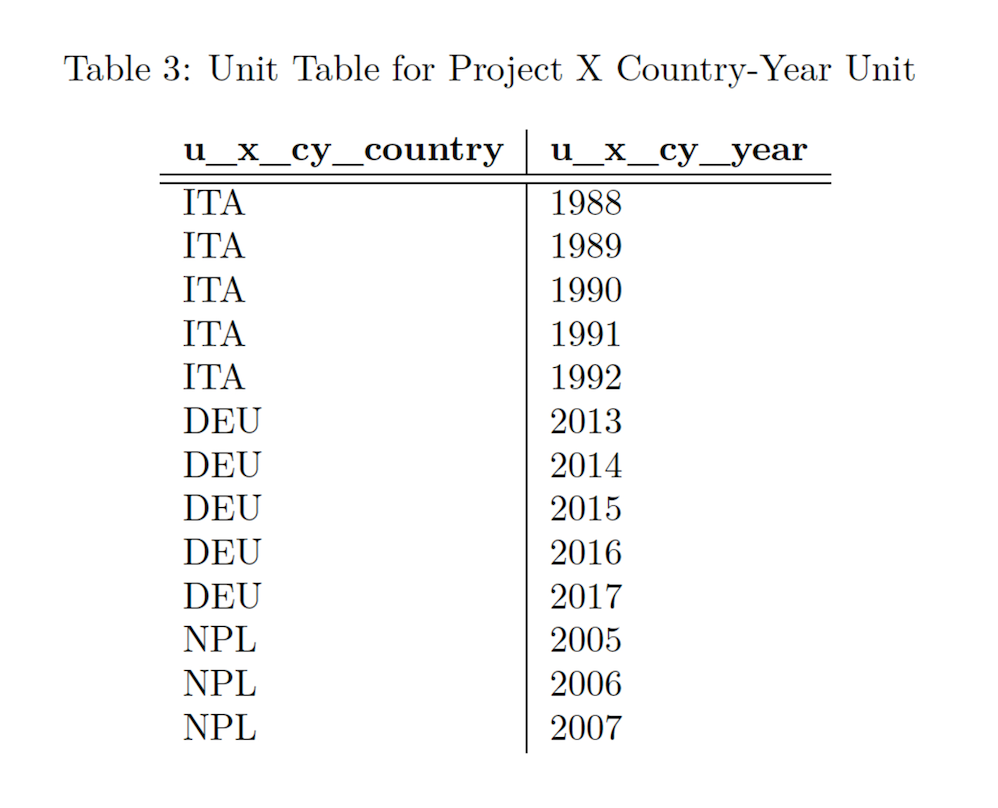
We first identify a unit grid, i.e., unit table for datasets with common dataset units, in this case the Country-Year unit for Dataset A and Dataset B.
The Country-Year Unit Table for Project X contains all country-year combinations from Dataset A as well as all country-year combinations from Dataset B without duplicates.
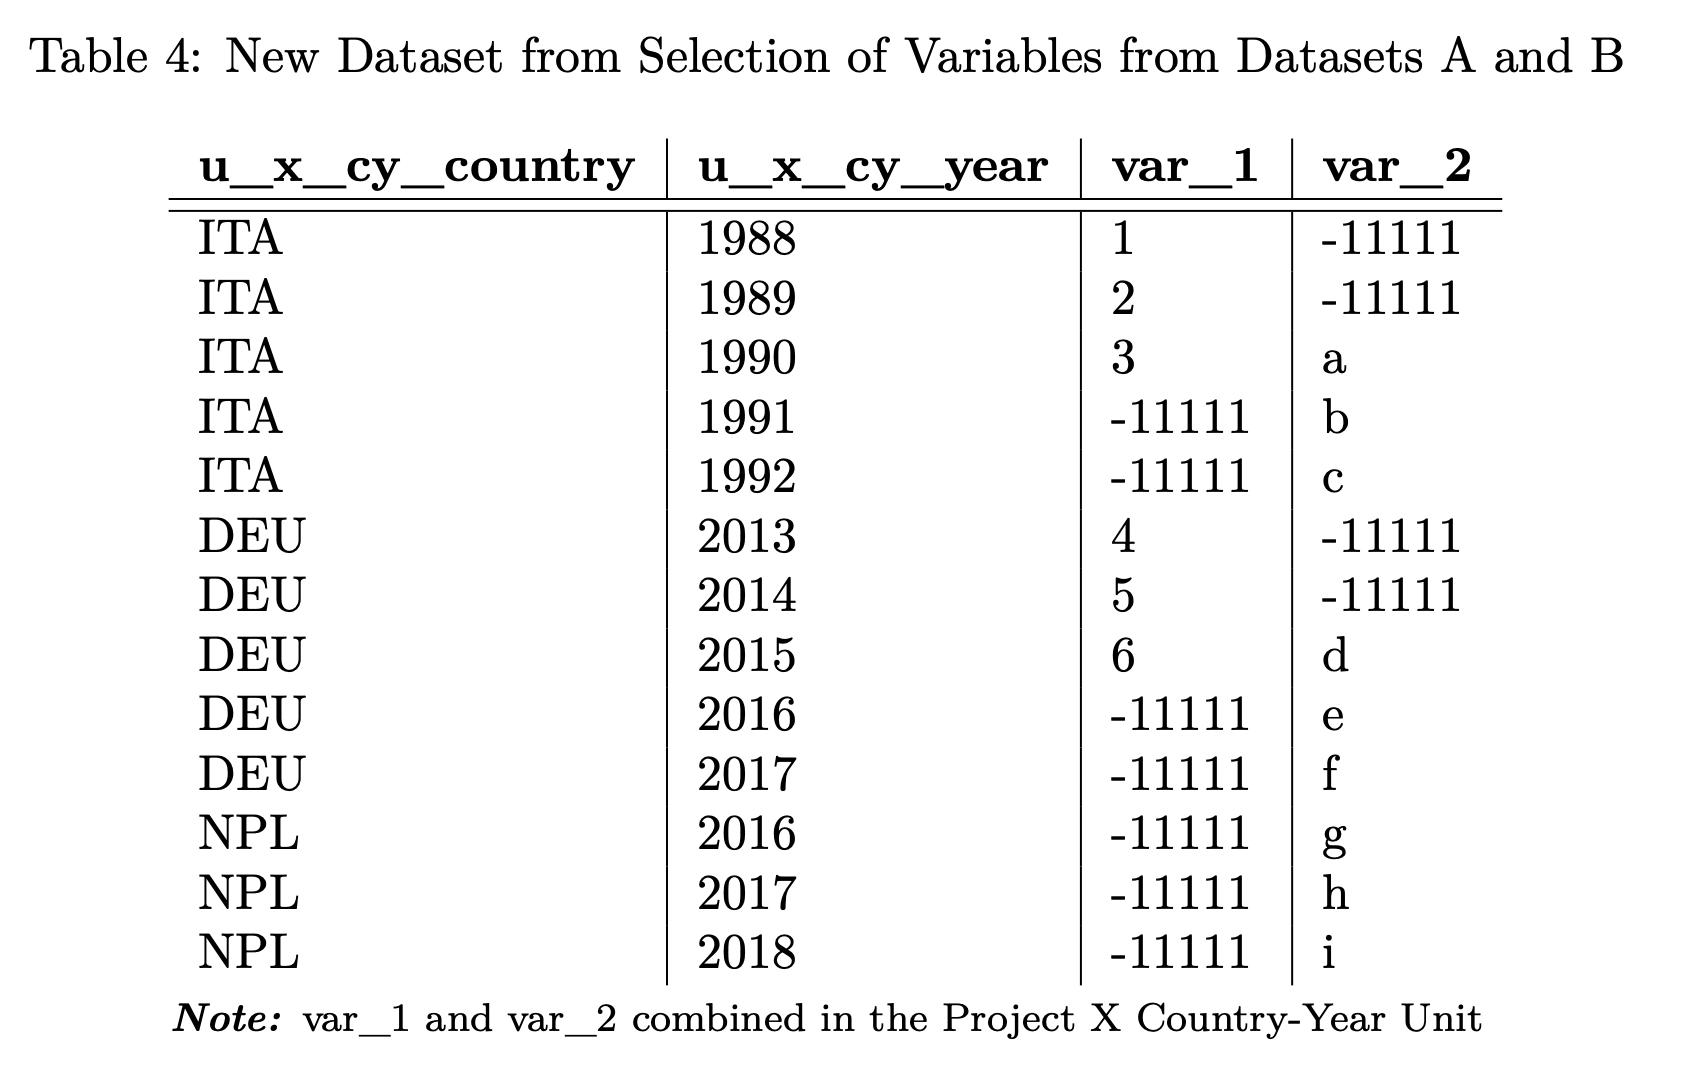
If a user now selects the Output Unit Project X Country-Year Unit, and also selects the variables var_1 from Dataset A and var_2 from Dataset B, or even both at the same time to be expressed in this Output Unit, they receive a new dataset with twelve rows sorted the same as the unit table and containing the selected variables.
As Dataset A does not include all country-years included in Dataset B and vice versa, but the unit table encompasses all combinations from both datasets, var_1 and var_2 have missing values (-11111 = "missing from merge") for those Country-Year combinations not included in their original dataset when retrieved through the Country-Year Output Unit of Project X.
At this point we assume that every dataset has a Primary Unit and an attached unit table. Note that many Output Units may have only been constructed using a single dataset. Also note that Output Units are constructed across datasets within the same member project, but never across datasets from different member projects. The Country-Year unit table for Project X will thus not include Country-Year observations from datasets in Project Y if these country-years only exist in project Y.
Datasets that belong to the Country-Year Unit of Project X can now be translated to Other Units, e.g., the hypothetical Country-Year Unit of Project Y. Through aggregation and disaggregation, datasets that initially collect information on a country-year level also become available in other Output Units such as Cabinet-Date or Agency-Year.
Detailed descriptions for translations between all Output Units in Demscore as well as descriptions of all Dataset-to-Output-Unit combinations are available in the Methodology Document. We recommend to thoroughly read the Explanatory Notes section of the Document when downloading data through Demscore.

We also provide static codebooks for all included variables from all partnering research projects. Please note that the original codebooks provided by the Demscore partners contain more details on data collection efforts, the creation of indices, etc.